
Last week, whilst presenting the CodeHarbor Report-Engine, an engineer stated, I already have a dashboard. He was puzzled as to why he needed a report, if he already had Zabbix and Grafana in place for his dashboarding. Asking multiple other engineers, I noticed that there is a major misconception on the term “Business Report” . This de me wonder, Reports vs. Dashboards, what are the key differences and wich one you need.
In an era where global spending on data analytics is projected to hit $420 billion by 2026, the choice between a report and a dashboard isn’t just about aesthetics—it’s about survival. While the human brain processes visual data significantly faster than text, a staggering 53% of business leaders admit their collected data goes completely unanalysed simply because it isn’t presented effectively. B
A dashboard is not a Business report, there is a significant difference between both. In this post I’ll try to explain the difference.
Comparison Table
| Dashboard | Report | |
| Primary Goal | Monitoring and “at-a-glance” status | Deep-Dive analisys and documentation |
| Data Nature | High-Level, accumulated and visual | Granular, detailed and often tabular |
| Timeframe | Real-Time or near real-time | Historical data (e.g.: weekly, monthly, quarterly) |
| Interactivity | High (filters, drill-downs, toggles,..) | Mow (usually static PDF or spreadsheet) |
| Length | Typically a signle screen | Can be multiple pages |
| Best For | Identifying trends and spotting outlines | Auditing, compliance and specific details |
If you are interested in the Reporting capabilities of Zabbix, check our Report-Engine compare table
Dashboard
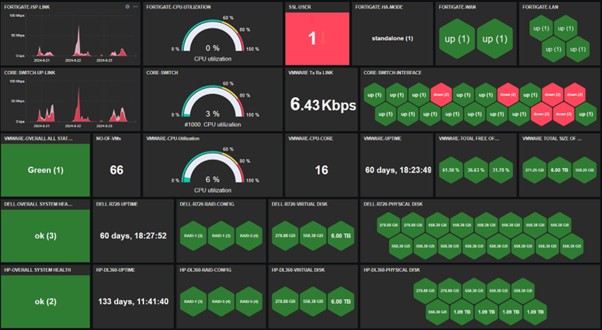
A dashboard is a visual user interface that organizes, accumulates, and displays key performance indicators (KPIs) and metrics in real-time or near-real-time, often using graphs, charts, and gauges.
A dashboard is most often used to monitor an environment or resources in real-time. Very valuable for a NOC, SOC or support service. On the other hand, a dashboard is often used by customers or stakeholders when they experience issues. By verifying their Dashboard, they can have a quick view on possible reasons or incidents.
In an most situations your monitoring will also send alerting traps to inform staff of incidents and/or resolutions. Making a dashboard a functional tool in identifying high impact incidents.
A Dashboard is a native part of Zabbix, of often Graphana can offer additional value in your dashboard needs.
Report
A Business Report is a structured document that collects, analyses, and presents data, metrics, KPI’s and technical findings, mostly historical to facilitate evidence-based decision-making. It contains over-time evolutions of resource usage and system load.
A business report is most often used to inform stakeholders and/or customers on the situation on a defined historical timeframe. This can be to a stakeholder, to inform on load and resource optimalisations or expansions. Or to a customer to demonstrate incidents and/or problems that have been handled.
A business report is not directly used in the NOC, but more often in the boardroom or in service meetings. In a previous career, as a Service Manager, Such Business Report was my best weapon and proof of the work our organisation was doing for the customer, and giving an objective view on SLA’s and performance. Consistency in your reporting is a key factor in the relation with your stakeholder or customer. It should be a recognisable document, that enables everybody to get a correct status in a glance, for some that could be the graphs, for others the SLA’s and others might be more interested in the passed alerts. A good Business report offers a solution for many stakeholders.
Zabbix does not offer native reporting. Here the CodeHarbor Report-Engine offers the ability to create and schedule a consistent and meaningful report.
Conclusion
As shown, a dashboard is not the same as a business report. Each has a great value in an organisation, but the content, goal and audience is very different. Be sure to make the right decision in setting up either a dashboard, or a business report.