
Even during the summer, innovation never stops at CodeHarbor! We’re thrilled to announce the release of CodeHarbor Report-Engine V1.3.1, packed with powerful new features designed to give you even greater control and clarity over your monitoring data.
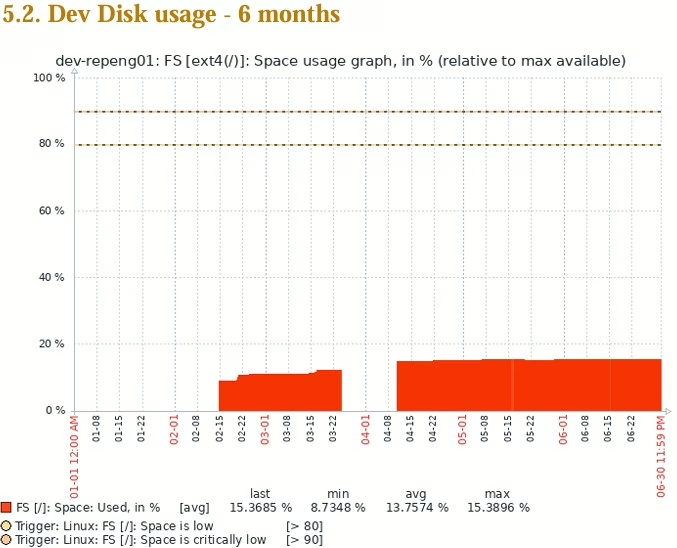
The highlight of this release is the introduction of Custom Timeframes in your graphs. While standard reports offer a snapshot of your recent data, V1.3.1 empowers you to dive deeper. Imagine effortlessly visualizing resource usage trends over the last 6 months or even a full year, revealing critical long-term patterns that impact your business. This enhanced capability provides more in-depth business insights, allowing you to tell the complete story of your environment’s evolution, not just the latest chapter.
See the Difference:
- Standard Monthly Report Graph:
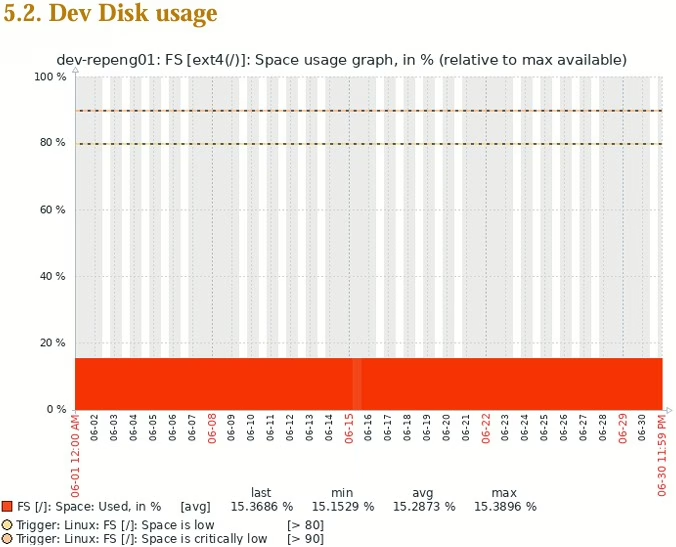
- Disk Usage Graph, Showing the Last 6 Months:
Beyond the Big Feature:
We’ve also implemented several key enhancements and bug fixes to improve your overall experience, including:
- Resolution of a “Divide by Zero” miscalculation
- Updated subscription administration for smoother management
- Improvements to reduce email spam scores
- Comprehensive documentation updates
We’re confident you’ll appreciate the enhanced capabilities and improved performance of the CodeHarbor Report-Engine V1.3.1 for Zabbix. Get your Report-Engine today and start unlocking a new level of insights!