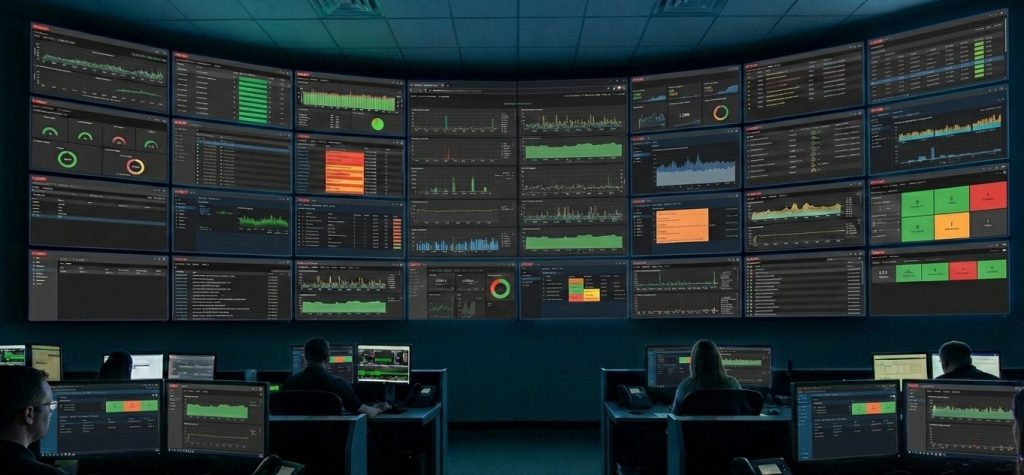
Recently I was talking to several IT managers. To my surprise, the majority of Companies are still using multiple monitoring systems to monitor and alert on their ICT infrastructure. I used to be in this situation, but was lucky enough to resolve this, and actually, this is also how CodeHarbor Report-Engine was born.
Further in this post I’ll let you all in on how we where able to resolve this.
Challenges
The fragmentation towards multiple monitoring tools offers several challenges.
- Knowledge requirements
Maintaining multiple systems offers challenge in your required knowledge and resources. Both in smaller and large teams. For smaller ICT teams, a few engineers need knowledge on multiple tools, this limits the capabilities to get most out of you (often expensive) tooling. In larger teams, the challenge will be to align all resource monitoring towards one standard.
- Inconsistent alerting
Every monitoring system has it’s own strengths and weaknesses in regards to alerting. Most tools offer e-mail or dashboard notifications, but when searching the right way to get emergency alerts to other channels, the options are overwhelming. Teams, SMS, WhatsApp, Telegram, Discord, Jira,… And let’s be honest finding one channel that fits all solutions… unlikely. So your on call teams are obligated to have multiple input channels for emergency alerting
- Data Fragmentation
When your monitoring data is scattered over multiple systems, it’s not feasible to get a complete resource usage, or performance overview. Offering issues in incident and problem management because there are only limited possibilities to perform end-to end investigations. E.g. when resources are over-used, is there a link to network traffic, monitored in a different system?
- Inconsistent reporting
In order to create a good report, it’s required to get a consistent view of your data. To gathering data out of multiple monitoring systems you will need to do so in part manually. This takes time and is error sensitive. Nothing worse than offering inconsistent and error reports to your stakeholders.
Opportunity
As mentioned, in previous functions I found the same issues, but I had the opportunity to perform several migration tracks, integrating all monitoring onto one system. A first hurdle was finding the right tool. After some research and POC’s, we found that Zabbix was the tool of our choise. Zabbix offered the right level of possibilities to monitor all of our data centre components and resources. And with it’s large community and wide range of support partners, we found the right monitoring tool.
When you are also struggling with tool sprawl, allow me to give some guidance and tips on how to proceed.
- Conduct an Infrastructure Audit Identify every monitoring tool currently in use, document their specific functions (e.g., network, server, cloud, or APM).
- Define a Unified Monitoring Policy Establish standardized requirements for alerting thresholds, data retention, and event triggering. Ensure these requirements are aligned with business goals so that Zabbix can be configured to meet the needs of all stakeholders.
- Leverage Zabbix’s Native Versatility Use Zabbix’s wide range of collection methods—such as SNMP for network gear, Zabbix Agent 2 for deep server insights. Its robust API for cloud/container environments and define what protocols to use for your different components.
- Implement Standardized Templates and Low-Level Discovery (LLD) Accelerate the migration by using or creating universal Zabbix templates. Use LLD to automatically detect and monitor new assets (like disks, interfaces, or services) to ensure consistency and reduce manual configuration errors.
- Execute a Phased Migration, preferably with ITSM Integration Start with a Proof of Concept (PoC) in a non-production environment. Once validated, migrate hosts in batches and integrate Zabbix with your ITSM platform (e.g., Jira or ServiceNow). This ensures a seamless incident management workflow.
- Team Enablement and Legacy Decommissioning Train your IT staff on Zabbix’s advanced features. Set deadlines to decommission legacy systems once Zabbix has reached data parity and the team is confident in the new environment.

We had multiple successes implementing Zabbix. It offered all the flexibility and options we needed to monitor a complex multi-data center environment. Zabbix has a large community of partners that can assist you in any of the above steps.
Reporting
Once implemented, our customers and stakeholders asked to provide reporting on the status of our environment. At first we used Zabbix Dashboard reporting, but found that this could not offer the management level reporting and insights that where required. It is from that experience that the idea for a Report-Engine was born. And once Zabbix introduced it’s API capabilities, we where on a straight line to create the CodeHarbor Report-Engine for Zabbix.
So the CodeHarbor Report-Engine for Zabbix really completed our Zabbix implementation, and enabling your NOC results to enter the Boardroom.


